Trust your engine to the best technology available today -- G3-G4
Here's why you should install G4:
Leaning:
G Series is the best technology available, there’s nothing else like it, nothing even comes close. Operation lean of peak requires special information that only the G3 or G4 graphic Engine Monitor can provide. The G Series instruments are extraordinarily capable yet easy to use. G Series specialized innovative leaning process is the first and only one to ever earn a patent, which may be read here.
Unprecedented in its sophistication, most
importantly it makes a complex process easy to
accomplish. Leaning with reference to temperature only is just
too confusing for LOP. Our specialized process reports each individual
cylinders status in unambiguous form. You needn’t
ponder if a cylinder is rich or lean, the G Series will
display that too.
Injector Analysis
Nozzle flow uniformity is paramount to operation lean of peak but only Insight delivers a nozzle analysis every time you lean. The G Series can forewarn of problems and assure uniformity of results. Of course, other systems just leave you in the dark.
G Series Data
G Series instruments are not just temperature indicators, they compute real-time results using manifold pressure, RPM, fuel flow and temperatures. G Series handles the raw data to eliminate confusion and provide answers. It couldn’t be easier. While constantly displaying critical information during flight the G Series always work diligently behind the scenes too, logging data to a handy SD card for study later so nothing is missed. It’s easy to go back in time, study trends and trace problems to root the cause.
Innovation
Decades ago Insight introduced the first instrument
to display cylinder and exhaust gas temperature of
all cylinders simultaneously.
This innovation eventually became the industry
standard as all other manufacturers followed suit.
Engine monitors depend on numerous temperature
probes that have equal potential to inform or confuse
when any of them fail. In fact probe failures can easily be confused with
engine failures. Only the G Series has a probe diagnostic
system built in.
Manufacturing G Series at Insight
Insight's 610C Graphic Engine Monitor (G3) color-coded bargraph
and digital values may be Primary for CHT, EGT and TIT.
All
other data shown in cyan at the top of display are to be
supplementary.
Traditional multi-cylinder exhaust gas and cylinder head temperature systems that force the pilot to switch or scan an indicator from cylinder to cylinder in search of critical engine data, are long obsolete. Using the latest computer technology, the G3 presents a clear, concise, graphic picture of all engine temperatures simultaneously for interpretation at a glance.
Never before has so much engine diagnostic information been available to the pilot and never before, has the pilot been able to control mixture with such ease and precision for peak fuel efficiency.
Insight's latest G4 automatically records flight temperature and will also interface with other data sources and report information to other instruments like MFD’s. The data-log files stored on the SD card can be easily retrieved by the pilot, in-flight or post-flight, for instant viewing or permanent record-keeping.
The G4 is a sophisticated tool for engine management. Its microprocessor performs many tasks that used to be handled by the pilot. One of the basic functions performed by the G4 is monitoring exhaust gas temperatures for all cylinders with one degree resolution. What is important is the exhaust gas temperature of a particular cylinder in relation to its peak. But peak EGT is not a constant; it changes with atmospheric conditions, altitude, power setting and engine condition and for this reason absolute exhaust gas temperatures in degrees Fahrenheit are quite meaningless.
The real objective of mixture management is finding a
mixture setting which represents the correct position on the
EGT/Fuel Flow Curve. As we will see later, this abstract
task is easily accomplished by the G4's microprocessor which
samples EGT's for all cylinders many times a second and
subjects this data to a complex mathematical analysis can
identify peak. This capability allows the pilot to operate
his or her aircraft engine at the most economical mixture
settings.
It is generally known that EGT can be a valuable source of
information for engine diagnosis and troubleshooting, but
there is a great deal of confusion when it comes to
interpreting this data. One of the basic principles of EGT
engine analysis is that engine temperatures (EGT and CHT)
achieve equilibrium in an engine operating at a constant
power and mixture setting. What is often overlooked is that
this equilibrium cannot be defined as a single point but
rather a range of temperatures.
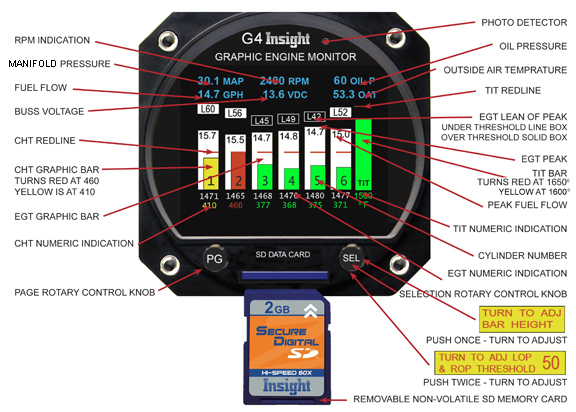
The Graphic Engine Monitor (G4) is ready to operate the
moment electrical power is applied. Within seconds after
starting the engine, the white EGT bar graph columns will
begin to appear on the G4 display. Each column corresponds
to the Exhaust Gas Temperature (EGT) of a cylinder. The
lowest exhaust gas temperature that can be displayed by the
G4 is 800° F. In some engines, the throttle will have to be
opened to the fast idle range to get an EGT indication for
all cylinders. As the cylinder heads begin to warm up, the
display will indicate Cylinder Head Temperature (CHT) for
all cylinders as a smaller green bar in each EGT column. A
horizontal red line across each column represents the
maximum allowable CHT. Digital numbers below each bar graph
column indicates the exact EGT and CHT for each cylinder.
G4 Twin Buss Voltage
The G4 Buss Voltage attempts to display the buss voltage in green when it’s normal and red when it’s outside of normal. In an aircraft with a 12V electrical system the Buss Voltage will be annunciated in green so long as the voltage is 12.0V to 14.9V (inclusive).In an aircraft with a 24V electrical system the Buss Voltage will be annunciated in green so long as the voltage is 24.2V to 28.7V (inclusive). Below this range the alternator isn’t charging the battery and above that it’s overcharging, and the Buss Voltage will be annunciated in red. The instrument must be connected to the main voltage buss (not in series with something else, on a lighting buss, etc.) and must have a good low-resistance ground connection, otherwise the voltage measurement itself will be in error causing the Buss Voltage to indicate in red erroneously.
Controlling the G4 instrument
The instrument has two control knobs that operate combination rotary and push button switches. The PG knob in general controls screen selection while the SEL knob controls items within the given screen. Each screen assigns its own functional needs to the controls that may change depending on context. A screen may also label the controls with guidance information like “Push to exit”.
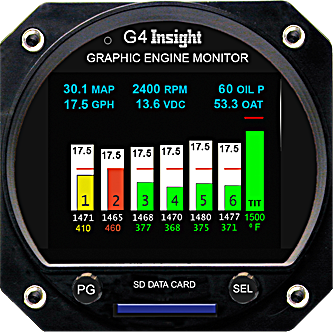
The Bar-Graph Display Screen
The Exhaust Gas
Temperature is displayed in white bar graph form and is
interpreted much like a conventional mercury thermometer.
The higher the bar, the higher the temperature.
The cylinder head temperature is displayed in green single
bar format. During normal operation it shows as a green
illuminated bar in the lower half of the bar column. Since
EGT is normally higher than CHT, the green bar which
represents CHT is on top of the white illuminated EGT bar
and stands out clearly. However, when the engine is
shutdown, the EGT quickly drops to zero and the cylinders
remain warm for sometime.
The G4 provides a reliable indication of cylinder head
temperature even with the engine shut down. Should an EGT
probe fail, the entire EGT column for that cylinder will go
blank, and the numeric indication will show --- that is
dashes, but the CHT bar will still remain green. The failure
of one probe will not affect the display of any other probe.
AVWeb Insider - New Insight Engine Monitor and So Much More
By Rick Lindstrom
Insight, the originator of the Graphic Engine Monitor, surprised
everyone by unveiling a new third generation GEM called G3 at
Sun n Fun. By no means a luke warm sequel the G3 is
a breakthrough product.Featuring a bright full color display it offers numerous screens
of new functionality previously unavailable anywhere. While the original lean screen is gone a vastly improved screen
replaces it with special functionality for lean of peak
operation. G3 logs data to readily available SD digital camera cards. A low
cost card will store decades of flight data. The new G3 writes
PC compatible files and directories so no special software is
required to process or transfer data. Its extensive data log
files include flight data from Insight’s TAS-1000 air data
system and nav info from your GPS. Despite its enormous capabilities the new is a compact size and plug-compatible replacement for all previous
GEMs. Insight offers a generous GEM trade-in to make upgrades
easy.
Restarting The Leaning Process
Restart the leaning
process and resetting the peak indications on G1 by short push
of bottom button.
Restart the leaning process and resetting
the peak indications on G2/3/4 single by a short push of the SEL
button.
Holding the SEL knob for about 3 seconds on G4 twin
will take you back to twin-engine screen.
 Probe Screen
The Need for better Diagnostic Tools
Even the first GEM could detect an open probe and blank its indication. Over the years by helping owners and their mechanics trouble shoot instrument problems I developed a new understanding and sympathy for the challenge they faced.
Troubleshooting avionics is an expensive and time-consuming process. Often times the procedure requires access to the instrument connector for continuity measurements. This might take hours of instrument panel disassembly just to touch the connector. We needed something better, easier to use, less time consuming and therefore less expensive.
Why not have the instrument diagnose itself? Then you don’t have to disassemble the airplane or even touch the wiring. This is not as easy as it might seem. Adding resistance measurement hardware for each and every probe wire would more than double the complexity of the measurement system. I considered this carefully during the development of the GEM-610 second generation instrument. It would at least add a second PC board to the instrument and have even greater adverse impact on the GEMINI twin version. Even if we endured these problems to get the information we had no practical way to display it on an orange bar display.
So I abandoned it then, but revisited again this time. The new color display was certainly adept at displaying the information, eliminating that problem, but the resistance data was still hard to get.
So this time I was able to invent a new way of measuring resistance. The simple idea worked beautifully without adverse impact on the design. It was so simple in fact even I was skeptical at first.
Without this simple breakthrough we’d still be diagnosing things the hard way.
So what does the diagnostic system do?
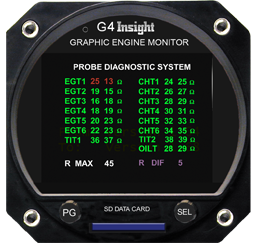
The probe diagnosis page indications are in
green for normal readings and red for readings
that fail the criteria set at the bottom of the
screen.
Each temperature probe consists of two wires, a
positive lead and a negative lead. The two
numbers next to each identifier show the
resistance in Ohms of each lead.
For example, the line EGT1 8 3 means the
positive lead of the EGT1 probe has 8 Ohms
resistance, and the negative lead has 3 Ohms
resistance.
When the probe is new, it will have relatively
low resistance.
As the probe ages, it’s resistance will slowly
go up. Eventually, the probe will measure
outside the pas/fail criteria you set at the
bottom of the screen, and change from green to
red, indicating that the probe should be
replaced before it fails and leaves you with no
temperature reading at all.
One other point to consider is that the longer
the wiring to the probes, the higher its
resistance.
Every foot of EGT wire adds 1.7 Ohms/ft for the
+ lead and 0.8 Ohms/ft for the - lead. Every
foot of CHT wire adds 0.8 Ohms/ft for the + lead
and 1.2 Ohms/ft for the - lead.
A 24 ft harness will fail the criteria that an 8
ft harness will pass with. That is why we allow
the user to modify the pass/fail criteria on the
bottom of the screen.
The meaning of the
pass/fail criteria is as follows:
R MAX sets the maximum resistance (in Ohms) that
any single lead may have. If the R MAX is set to
20 Ohms a probe with either the positive or
negative leads measuring greater than 20 Ohms
will be annunciated in RED, otherwise its
displayed in GREEN.
R DIF sets the maximum resistance (in Ohms) that
the positive lead may differ from the negative
lead. If R DIF is set to 10 Ohms, the positive
and negative leads need to measure within 10
Ohms of each other to be annunciated in GREEN,
otherwise its RED
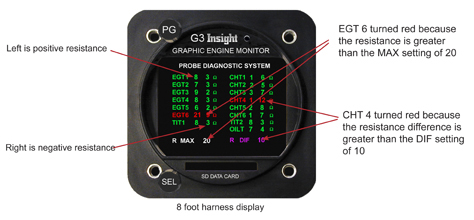
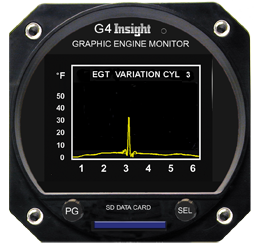
EGT Variation Screen - View Mag Ad.
This is a new form of engine analysis.
Some valve related engine faults produce a slow periodic
variation in EGT. The oscillation rate is on the order of one cycle every minute
or two. This is just too slow to be identified by occasional
observation of the temperatures alone. Yet it is very important
to discover this phenomenon because it may lead to a
catastrophic engine failure. It readily appears in a slow
sampled spectrum analysis.
Temperature samples are collected once per second for each
cylinder and analyzed each second. The entire sample interval is
about 8 minutes. A normal indication will be a flat line with a
little noise, while a trouble indication will show as an obvious
spectral peak.
Vibration Screen
New Capabilities for the Next Generation G4 GEM
If you take a step back from the EGT/CHT idea to explore engine monitoring in general, you discover that at least half the engine monitoring solution is missing. EGT analysis reveals combustion phenomenon but simply ignores mechanical problems.
By the time a mechanical problem shows up in EGT, if it ever does, the damage is done and it is far too late to do anything about it.
Vibration analysis is the key to pre-emptive detection of mechanical problems.
Following the update of the G4 Graphic Engine Monitor to V1.78 or higher, the Vibration Analysis screen will now appear among the supplementary screens when the PG knob is turned. In order for the vibration analysis to function your G4 must be equipped with a vibration sensor and a connection to the magneto for RPM measurement. If your instrument was purchased prior to September 2011, Insight will be sending you a vibration sensor shortly. Instruments purchased after this date will ship with the sensor included with the main kit.
After the electrical connections to the sensor are made, then sensor may be tested simply by powering up the G4 and vibration sensor. It is not necessary to start the engine to perform this test. The sensor LED should flash briefly and rapidly when power is first applied until communication is established with the G4, at which time the LED blinks more slowly (approximately once per second). When the LED indicates communications with the G4 has been established select the Vibration Analysis screen by turning the PG knob. While observing the vibration graph disregard the “RPM Required” message and rap lightly on the vibration sensor with the handle of a screw driver. The graph should register the impacts.
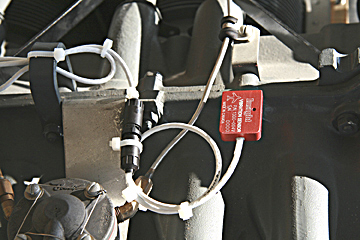
The sensor should then be firmly mounted directly to the engine case, preferably oriented in such a manner as to match the small airplane symbol engraved on the sensor body. In some rare cases it may not be possible to mount it in this manner, and the installer will have to fabricate an appropriate bracket or else be prepared to compensate for the change in orientation when viewing the vibration data. A representative installation is shown in the following figure:
Using the Vibration Analysis Screen on the G4:
The sensor detects vibration in all 3 axis (fore-aft labeled x, up-down labeled z, and left-right labeled y) which are presented on different sub-screens. The vibration analysis only functions when the engine is running and a valid rpm signal is detected.
In regards to the vibration graph, the vertical axis represents the amount of vibration energy and the horizontal axis represents the frequency spectrum expressed as multiples of crankshaft rpm. When the engine is running, the screen will come alive with a waveform that represents the engine motion, presented in a spectral format with the crankshaft energies appearing at the 1x mark on the bottom scale. Propeller vibration will likewise be synchronous with the crankshaft vibration. Other sources of vibration will tend to produce energies at other frequencies.
For example, camshaft vibration tends to accumulate at the .5x mark, since the cam turns at 1/2 the rate of the crankshaft. Magneto vibration will appear at 1.5x mark in a 6-cylinder engine. Alternator vibration may appear somewhere around 3x or 4x, depending on the ratio it is driven at.
A gear-driven alternator may appear in a different axis than the crankshaft does if it is mounted at 90deg to the engine, although ANY source of vibration will show some energy in all three axis. Complex vibration as generated by reciprocating machinery will also produce a great number of harmonic spikes, which at first glance may seem confusing. The user should experiment with running the engine at different power settings under different conditions to get a feel for what is a "normal" spectrum for their particular engine. A simplified case of vibration is shown in the following figure:
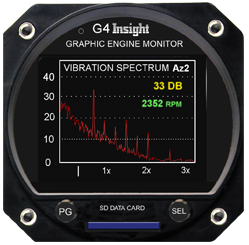
In the example shown above the main source of energy is at the 1x mark, and represents the crankshaft rpm. The smaller spikes at the 0.5x mark and the 1.5x point are probably created by the camshaft and the magneto, respectively. The user should be aware that a multi-cylinder reciprocating engine produces energies at a multitude of frequencies and directions, which reinforce and subtract from each other to create a very complex waveform. It is the responsibility of the user to gain familiarity with a waveform that is typical of their particular engine, so that unusual readings can be detected and interpreted.
The user may examine the various sub-screens by pushing the top button (PG). There are presently six screens to examine, each of the primary axis (X,Y and Z) and an averaged version of each (denoted Ax, Ay, and Az). The averaged version will be much "cleaner" and contain less noise than the raw measurement and is the preferred screen to examine for each axis. The bottom knob (SEL) controls a cursor which will "snap" to nearby vibration spikes to make it easy to examine them closer. The bottom knob can also be pushed to enter a zoom mode. When in zoom mode, turning the bottom knob will allow you to scroll through the waveform. Continue to press the bottom knob to set progressively higher zoom modes. A further press when at maximum zoom will return you to the overall view.
Pressing and holding the PG button will trigger the G4 to save the present vibration waveform for future reference. The waveform will be stored as a series of hexadecimal bytes in the current log file. Insight can provide a tool for examining this waveform using Excel or a similar spreadsheet. The tool is presently in the earliest functional stages of development, and will be improved over time.
It is expected that the vibration functions will be used as a "condition-monitoring tool". Since every engine and accessory combination is different, everyone's vibration spectrum will look unique and it would be impossible to generalize the interpretation of the spectrum. The user will come to recognize what a "normal" spectrum looks like for their engine and by periodically scanning the vibration screen can recognize when potential trouble is developing. When a new spike appears or an existing spike begins to show signs of higher than normal amplitude further investigation is warranted. The source of the spike can be interpreted by noting its primary axis and its frequency relative to crankshaft RPM as discussed above. By periodically saving their vibration data as discussed above, the user can create a database of reference waveforms for future comparison.
While in-flight with the vibration screen showing on G4, Pressing and holding the PG button will trigger the G4 to save the present vibration waveform for future reference.
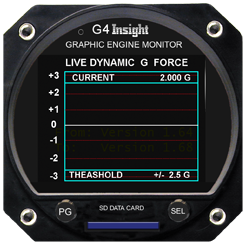
Take Off G Force Screen
Turbulence Display Screen
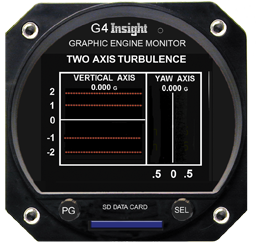
The G3-4 contains a 3-axis accelerometer sampled at modest rates to measure turbulence and landing shock.
Knowledge of G forces will help the pilot to operate the airplane safely by slowing to maneuvering speed. Landing shock is a good training aid for smooth landings and a predictor of structural damage.
Data logged G force will report unauthorized aerobatic activity or abuse of rental aircraft. It could also be useful in accident investigation.
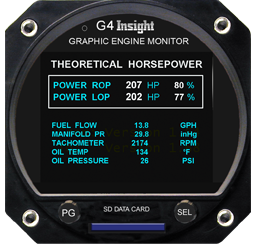
Measuring Horse Power Screen
 On
a test stand engine horsepower is derived by measuring the
twisting force (torque) that the engine exerts on a load. In
fact horsepower is defined as simply the product of torque times
RPM. Therefore
if our piston engines were equipped with real torque transducers
we could utilize RPM and compute real horsepower. While such
torque transducers are commonly used to calibrate turbo-prop
engines they actually cost more than a typical piston engine.
Sadly there is no practical way to directly measure horsepower
in a piston aircraft engine. But
this hasn’t stopped at least one engine instrument manufacturer
from making bogus claims to the contrary!
On
a test stand engine horsepower is derived by measuring the
twisting force (torque) that the engine exerts on a load. In
fact horsepower is defined as simply the product of torque times
RPM. Therefore
if our piston engines were equipped with real torque transducers
we could utilize RPM and compute real horsepower. While such
torque transducers are commonly used to calibrate turbo-prop
engines they actually cost more than a typical piston engine.
Sadly there is no practical way to directly measure horsepower
in a piston aircraft engine. But
this hasn’t stopped at least one engine instrument manufacturer
from making bogus claims to the contrary!
REMEMBER: There is no practical way to truly measure horsepower.
If you planned to use your horsepower display to gauge take off performance or measure engine health you can forget it. In fact, dynamometer tests of so-called horsepower displays revealed NO CHANGE in indicated “horsepower” even when individual cylinders were completely disabled!
The Insight Approach to Power
Despite some limitations we elected to put a power display in the G4 graphic engine monitor. To prevent any misconceptions we called it “Theoretical Horsepower”, and under certain conditions it actually does a pretty good job of reporting horsepower. One dependable metric of power is fuel consumption. At peak EGT and leaner where ample or excess oxygen available to consume the available fuel horsepower is a linear function of fuel flow. At richer mixtures where some fuel remains unconsumed and doesn’t contribute its full power potential the simple linear relationship falls apart. Prior to leaning to peak the display is challenged to deliver an accurate horsepower display but once peak has been reached the rich-of-peak accuracy will improve.
One limitation of the fuel method is that it is not sensitive to
engine faults that can significantly affect the power produced.
For example, a cylinder without ignition won’t combust the fuel
to produce power, but will nevertheless continue to consume it.
So don’t expect to diagnose engine performance issues with the
fuel flow approach to horsepower calculation.
What good is a fuel flow based horsepower calculator? The intended purpose of the theoretical horsepower display is to provide an indication of power for leaning purposes. For example, lean-of-peak operation is not recommended at power settings greater than 65%. It is interesting to see the reduction in horsepower that accompanies lean of peak operation.
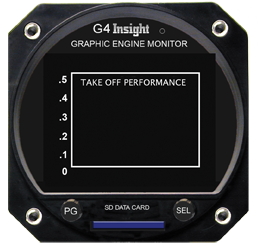
The Insight Approach to Performance Measuring
While the G4 does not directly measure true horsepower (remember that no engine monitor does) it does measure the EFFECT of horsepower on takeoff acceleration. This information is displayed on the “Take Off Performance” screen and recorded in the log file too. Acceleration is direct function of engine thrust and other factors like weight, runway conditions, slope and even tire pressure. Of course, ambient conditions like altitude and temperature will affect engine power and therefore take off performance.
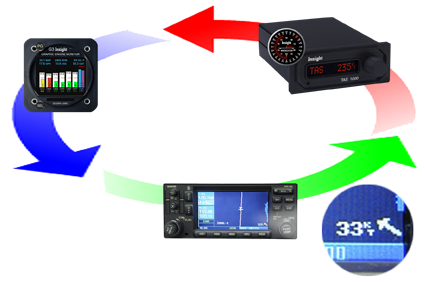
Insight announces the next big breakthrough in engine monitoring
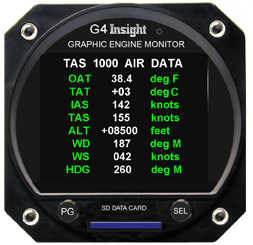
In G Series Software Version 208 the G3-4 has a new page that displays data received from the TAS-1000.
The GEM's data-logging capabilities can be extended by receiving air data from a TAS-1000 air data computer. This page shows real-time air data which includes True Airspeed, Pressure Altitude, and Wind Speed and Wind Direction all of which are recorded in the GEM's data log along with engine and fuel data.
Insight’s G3-4 is now capable of receiving RS-232 serial data from our TAS-1000 MFDS that includes Indicated Air Speed, True Air Speed, Pressure Altitude, True Air Temperature, Wind Direction, Wind Speed, and Heading in the data log file on every flight.
While the detail in the G3-4 data log is unprecedented – now it is even better.
The G4 engine log system has been transformed to a complete aircraft performance logging system.
Now you can log aircraft performance data right along with your engine data.
The missing link in data log analysis is finally available.
Now you can really tell what’s happening. Much of the black-box functionality previously available only in Jets is now available to you.
The key to operating your aircraft efficiently is understanding its performance. Now every data log is like a performance chart from the flight manual but it is specific to your aircraft and actual conditions.
Don’t forget about the Insight TAS 1000’s ability to fill in your GPS pages with real-time air data, fuel, wind data page and also with wind arrow and wind speed on your moving map.
With no TAS the G3-4 displays
only OAT (Outside Air Temperature) but with
a TAS-1000 the
missing link in data log analysis is finally available.
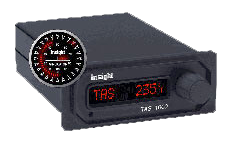
With the TAS installed in addition to OAT the G3-4 displays also displays
- TAT (Total Air Temperature)
- IAS (Indicated Air Speed)
- TAS (True Air Speed)
- ALT (Pressure Altitude)
- WD (Wind Direction)
- WS (Wind Speed)
- HDG (Heading)
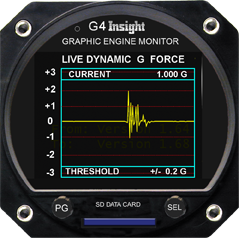
Turbulence and Hard Landings:
Now we go back in time to capture a turbulent transient or a landing event. In the miscellaneous configuration screen the pilot can now set the threshold for the vertical axis G-force. Every time this threshold is exceeded the G3/G4 records a 12 second interval of the turbulence in the log file.These twelve seconds consist of data from the 6 seconds before the event and the 6 seconds after it.
There are two new screens between Two Axis Turbulence and Takeoff G-force which display live G-force and a snapshot of the G-Force from last event (threshold exceeded).
The user can view a graph of the last 12 seconds of live data or view the last captured event. This feature will also capture hard landings. The graph is automatically scaled for maximum zoom based on threshold. When the threshold is exceeded the 12 second G-force is also recorded in the log file.The new transient G-force screen shows you the whole event the moment it happens. You won’t miss a thing.
The event is also marked and stored in the log file for easy reference later.
The pilot can set the trigger threshold on the G-force screen for normal operation. Just prior to landing the instrument automatically resets that threshold to always capture the landing event. Just 6 seconds after touch down a high resolution picture of the landing is available.
It is all automatic, and couldn’t be easier.
This new feature is available on all new G3 & G4 instruments and is available at no charge to all current customers in the latest update.
Just download and update your instrument from our website.
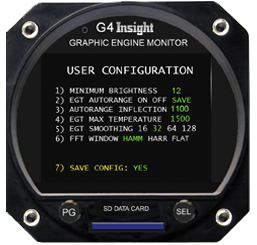
User Configuration
Using the knobs to
navigate the G3-4:
The G3-4 has two knobs: PD
select page and SEL work within page. There are two
functions built into each knob; the push button
switch activated by pressing the knob in, and the
selection is activated by turning the knob either
clockwise or counter clockwise.
The PG knob
is used to select the various screens. From the main
temperature bargraph screen turn the PG knob counter
clockwise 2 clicks to get to the User Configuration
screen. Once you are there you do not use the PG
knob any more because turning it takes you away from
the User Configuration screen.
The SEL button
is pressed to select a line for adjustment. When you
first enter a screen by default no line is selected.
Pressing the SEL button once selects line 1. The
selected line is shown in yellow. Pressing it a
second time selects line 2. On any line with
multiple selections the selected item will be shown
in red.
Setting up the G3 Temperature
Bargraph Display:
On the User Configuration
screen there are some options for setting up the
temperature bargraph display. There are three
different ways to accomplish this. One method is to
use the Auto range function to configure the display
for you.
Another method is to adjust the MAX EGT
TEMPERATURE and AUTORANGE INFLECTION parameters
manually, and a third method is to set the bar
heights visually on the main screen.
On line
2 (EGT AUTORANGE) there are 3 possibilities ON OFF
and SAVE. After pushing the SEL button until this
line is highlighted in yellow, the SEL knob may then
be turned to make a selection on this line. When on
line 2 turning the SEL knob fully counter clockwise
selects nothing. From there turning the SEL knob one
click clockwise selects ON. The current selection is
shown in red. Turning the SEL knob another click
clockwise selects OFF. And one more turn clockwise
selects SAVE.
Using the Auto Range function
(Method 1):
To turn OFF the auto range
capability on the User configuration screen:
Press the SEL button twice to select line 2 (EGT
AUTORANGE).
Turn the SEL knob to select OFF on
line 2.
Press the SEL button to select line 7
“SAVE CONFIG”
Turn the SEL knob to select YES on
line 7.
Press the SEL knob to save the choice.
We have now turned off auto ranging.
To turn
ON the auto range capability on the User
configuration screen:
Press the SEL button to
select line 2. (EGT AUTORANGE).
Turn the SEL knob
to select ON on line 2.
Press the SEL button to
select line 7 “SAVE CONFIG”
Turn the SEL knob to
select YES on line 7.
Press the SEL knob to save
the choice.
We have now turned on auto ranging.
In order to use the
auto range function it must be turned on as
described above. Once this function is enabled, the
G3-4 will automatically adjust the EGT MAX
TEMPERATURE and AUTORANGE INFLECTION to be
appropriate for the highest temperature reported by
the probes.
You should now take the airplane and
perform a typical flight.
The G3-4 will analyze
the EGT temperatures and scale the temperature bars
as required so that the entire temperature range
measured by the EGT probes is displayed on the main
bargraph screen.
It is important to realize that
so far this adjustment is temporary. If we want it
to remain permanent we must return to the User
Configuration screen.
To save the results of auto ranging:
- Press the SEL button to select line 2 (EGT AUTORANGE).
- Turn the SEL knob to select SAVE on line 2.
- Press the SEL button to select line 7 “SAVE CONFIG”
- Turn the SEL knob to select YES on line 7.
- Press the SEL knob to save the choice.
- The results are saved, and auto ranging is turned OFF.
The main temperature
bargraphs should now be scaled properly for this
individual airplane on all subsequent flights.
Auto ranging may be turned on and the range
relearned as often as desired.
Setting up the G3 Temperature Bargraph display manually (Method 2):
In some cases it may be desirable to set or
refine the temperature bargraph screen manually.
To do so, return to the User Configuration screen
and make sure EGT AUTORANGE is turned OFF as
described earlier. Adjust EGT MAX TEMPERATURE and
AUTORANGE INFLECTION directly by using the following
procedure:
To set an EGT MAX TEMPERATURE and AUTORANGE
INFLECTION on the User configuration screen:
Press the SEL button to select line 3 (AUTORANGE
INFLECTION) or line 4 (EGT MAX TEMPERATURE).
Turn
the SEL knob to select a value as desired. Notice
that adjusting the AUTORANGE INFLECTION affects the
value of EGT MAX TEMPERATURE and vice versa.
Press the SEL button to select line 7 “Save Config”
Turn the SEL knob to select YES on line 7.
Press
the SEL knob to save the choice.
AUTORANGE INFLECTION and EGT MAX TEMPERATURE explained:
The Autorange Inflection point is the point
along the temperature graph at which the scale of
the bars change.
Below the inflection point (ie,
at low temperatures) readings are displayed with a
coarse resolution (the bars go up/down a small
amount for a relatively large change in
temperature).
Above the Inflection Point (at
higher temperatures than the Inflection Point) the
bars are displayed in a higher resolution (the bars
go up/down more for a small change in temperature).
The net effect is that the dynamic range of the
temperature bargraph is increased. In other words,
we can show temperatures all the way down to room
temperature on the bargraph yet still show small
changes in temperature at the airplane’s operating
temperature range.
As an example if we set our
Autorange Inflection to be 1200 deg then
temperatures below 1200 will be rendered with
relatively few pixels/degree whereas temperatures
above 1200 will be rendered with more pixels/degree
to make temperature changes more obvious.
The EGT Max
Temperature simply defines the temperature that is
represented by a bar that is full screen in height.
For example if EGT Max Temperature is set to 1600
deg than a temperature of 1600 deg will be rendered
as a bar that reaches the top of the screen.
The G3’s Autorange Inflection is always 400 deg
below the EGT Max Temperature. Adjusting one will
therefore always affect the other automatically.
EGT Smoothing
The lower the number the faster
the sampling but less smooth (jumpier)
The factory
preset is 32.
Adjusting the bar heights from the main screen (Method 3):
An alternative way to setup the scale of the
temperature bargraphs can be performed from the main
screen.
Press the SEL button and a message
appears: “TURN-ADJUST BAR HEIGHT”.
By turning
the SEL button the heights of the bars may be moved
up and down.
Pressing the SEL button twice more
returns the G3-4 to its normal mode.
If we
return to the User Configuration screen, we will see
that EGT MAX TEMPERATURE and AUTORANGE
INFLECTION have been adjusted to reflect our changes
to the bar height.
If the adjustment is to
become permanent we must select Save Config and set
it to yes.
NEW Fuel Screens
Previously, there was no standard color scheme in the configuration screens.
Now, the selected line is yellow and the inactive lines are white.
YES/NO
in red has been removed by displaying only the word YES or
the word NO in green, when saving.
When there is a
choice of several items the selected item is displayed in
green.
Exactly one item is always selected.
The
choices of temperature units are Celsius or Fahrenheit then
either Fahrenheit or Celsius will be selected in green.
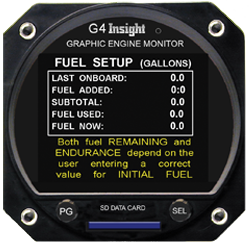
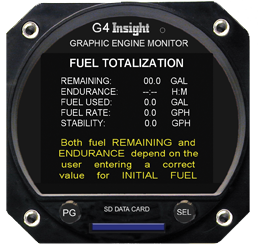
The FUEL TOTALIZATION screen has been improved and is even easier to use.
This change allows the pilot to see this screen before entering fuel on board.
Also setting initial fuel can be checked and corrected in
flight.
Previously the pilot had to enter the amount of
fuel onboard before he could view the Fuel Totalization
page.
Now both the FUEL TOTALIZATION page and the
FUEL
SETUP page are accessible at any time.
On the
FUEL
TOTALIZATION screen simply press the PG (left) button to
enter fuel, press it again when done. As before you can
top up the tank(s) by turning the SEL (right) knob counter
clockwise on the very first click.
Set total fuel onboard before take-off
Your G2-3-4 was preset at factory with your usable total fuel
To reach the FUEL TOTALIZATION screen from the main screen:
- Turn the PG knob counterclockwise one click.
- Push PG knob to go back and forth between the FUEL SETUP and FUEL TOTALIZATION screens
- On FUEL SETUP screen setting fuel gallons the lines FUEL ADDED, SUBTOTAL and FUEL NOW color will be yellow.
- Turn SEL knob to set gallons (Clockwise or Counterclockwise one click for total preset total fuel for your aircraft)
- At any time, you can push PG knob to go back and forth between the FUEL SETUP and FUEL TOTALIZATION screens to add more fuel.
G3-G4 have same screens
FF Stability
Displays, literally, the stability of your fuel flow over the last few seconds. The smaller the number, the less the fuel flow has varied in the past few seconds. A well-regulated fuel system will have a small number, a carbureted system can expect a larger number. The smaller the number the more likely you are to get an accurate fuel flow reading during the lean-find function. An larger number will make things more difficult.
GEM FUEL TOTALIZER CAUTIONARY NOTICE
The Fuel Remaining display on the GEM is very useful but is not without limitations. Understand first that the factory fuel quantity gauges are the only instruments in the panel that physically measure fuel level. They are still the primary indication of fuel level in the airplane.
The GEM doesn’t measure level, but instead measures only fuel flow rate. The GEM totalizes the rate information to account for fuel used. If you know how much fuel you started with and how much you have used you can figure fuel remaining by simple subtraction.
The pilot must supply an accurate starting fuel level for this subtraction to produce the correct fuel remaining result. Should the pilot overstate the fuel quantity on board, the GEM will dangerously overstate the fuel remaining and the endurance time as well. The pilot must be careful and diligent when setting the fuel on board.
Getting the correct fuel total on board is in many cases pretty easy. If you fill up prior to takeoff the number is obviously the total available on board. If you partially fill a known configuration (say tips empty) then the total is easy to calculate. If you partially fill fuel tanks or add an accurately know quantity to a poorly known original value - errors will abound. Unaccounted fuel loss from leakage, fuel vent overflow or theft will of course produce erroneous results. So be careful and the GEM will deliver safe, reliable, and convenient fuel information. But be sure to cross reference the information on the primary fuel quantity gauges. Never trust a single source of fuel information when you have two on board. Fuel exhaustion still ranks highly among accident causes. Don’t let your engine stop until you’re parked.