Setting G Force Threshold
There are SIX configuration screens. The Registration Config, General Information, Engine Configuration, Set Time/Date, K-Factor Initialation and MISC Configuration screens are accessible only on the ground. Setup mode accessed by rebooting instrument with top button held in.
The pilot can set the trigger threshold on the G-force screen for normal operation. Just prior to landing the instrument automatically resets that threshold to always capture the landing event.
Just 6 seconds after touch down a high resolution picture of the landing is available.
Here is a video on how to set Dynamic G-Force Threshold.
Or watch tech video of how to set GPS interface in G Series 3/4
MISC Configuration screen
1) Fuel flow GPS interface setting
2) Dynamic G-Force hard landing threshold trigger setting
3) Fahrenheit or Celsius
If you have a G3, G4 single, or G4 twin and update to the latest version your temperature measurements will remain in Fahrenheit unless you
configure your instrument for Celsius. So if you wish to keep using Fahrenheit do nothing further.
It is all automatic and couldn’t be easier.
This new feature is available on all new G3 & G4 instruments and is available at no charge to all current customers in the latest update.
Just download and update your instrument from our web site. Need help - Click Here
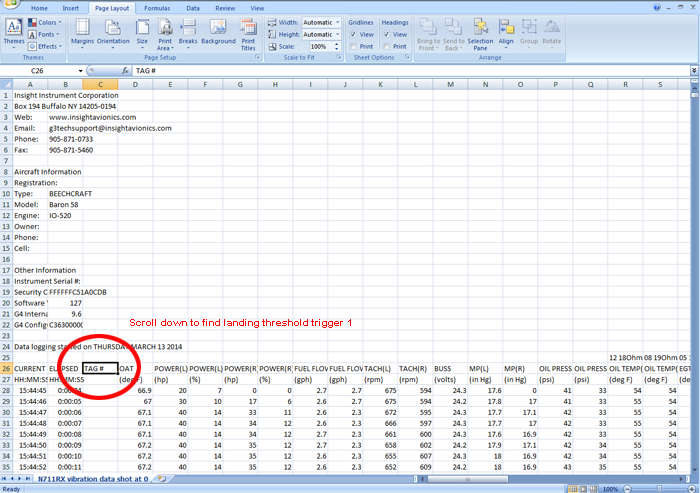
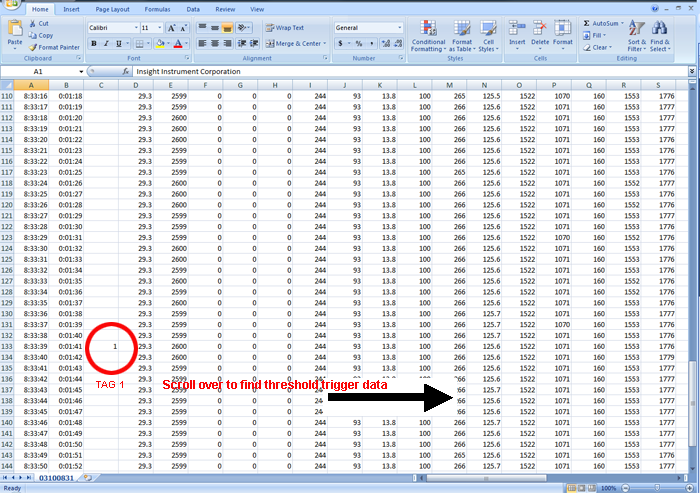
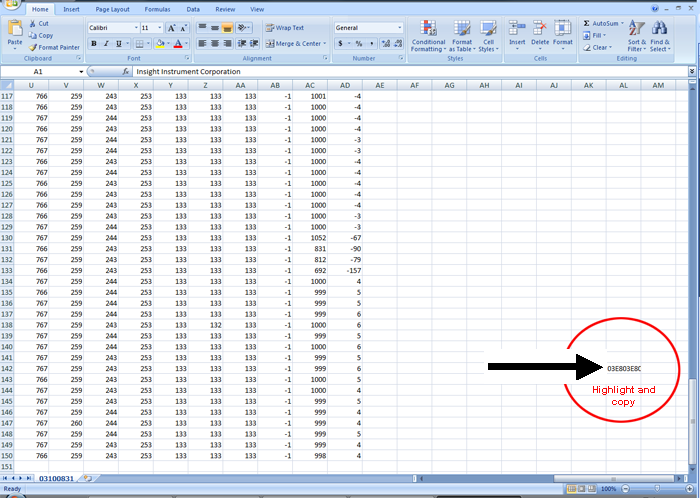
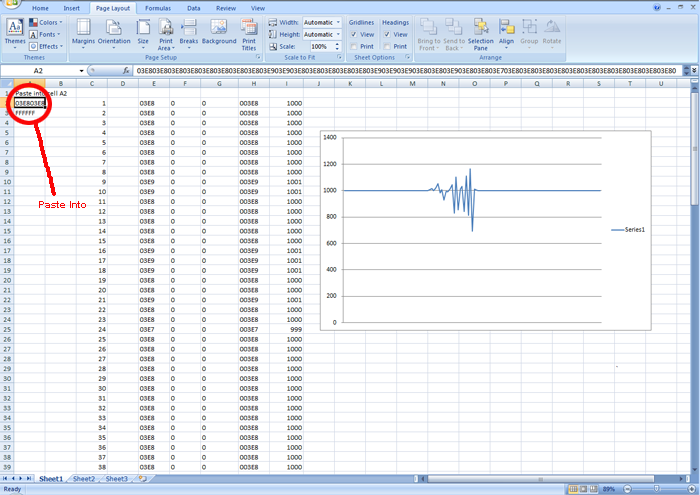
Here below is where to find the triggered threshold landing data in you flight file and graph it.
Q. What is the difference between the new "Live G Force" screen and the vertical component of the 2-axis turbulence screen?
It seems both are displaying the vertical component in Gs.
A. The TWO AXIS TURBULENCE screen displays the G force in the vertical axis and in the yaw axis simultaneously on one screen. The VERTICAL AXIS component of this screen samples the G force in the vertical axis once per second and displays the sampled value with an accuracy of three decimal points. The sampled value is plotted on a graph with a fixed scale that ranges from +2 Gs to -2Gs. As a result this fixed scale and fixed resolution small values are not easily discernible.
The latest version of the software for both the G3 (version 284) and the G4 (version 159) includes a new feature where the G3/G4 samples the G force in the vertical axis ten times a second. If the actual G force is ever outside the acceptable range, as defined by a user selectable threshold, then the G3/G4 willautomatically save a snapshot of the G force. The last snapshot taken is available for viewing directly on the G3/G4. Several possible conditions (e.g. rough turbulence, hard landing, or a steep turn) can trigger this automatic save.
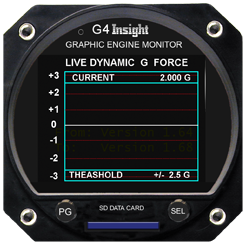
The pilot can set the G force threshold to any value from 0.2 Gs to 2.5 Gs in increments of 0.1 G. The default the value is 1.0 Gs. The most sensitive setting is 0.2 Gs. At this setting the G force must be within plus or minus 0.2 Gs or a snapshot will be saved.
If the G force exceeds the threshold then the G3/G4 will record not only the one value that triggered the capture but also all the sampled values of the G force for a twelve second period. This period consists of six seconds before the event and six seconds after the event.
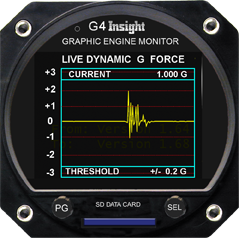
The one hundred plus samples of the G force provide the pilot or AP mechanic with valuable information from both before and after the event. The data from the last triggered snapshot is available on a new page entitled “LAST TRIGGERED SNAPHOT”. The live G force data is displayed on a new page “LIVE DYNAMIC G FORCE”.
These pages display the data graphically so you can tell at glance what is going on without having to wait for the data to get transferred to a computer.
The graphs auto scale based on the G-force threshold-providing maximum zoom for easy viewing.
![]()